Why we built a Place-Based Carbon Calculator
A blog post by Dr Malcolm Morgan, Research Fellow for Transport and Spatial Analysis in the Institute for Transport Studies
“Think globally, act locally” has been a mantra of the environmental movement since the 1970s. I have often thought it was telling that the call was to “act locally” rather than “act individually”, emphasising local communities rather than individual choices.
Yet when we talk about carbon footprints, we almost always think about the two extremes of spatial scale. Either the talk is of national footprints, UN conferences, and global action, or we focus on individual carbon footprints and minor changes in our behaviour. As a case in point, a recent edition of BBC Radio 4’s PM programme dedicated a slot on reducing our carbon footprint to pressing questions such as the relative merits of tinned beans vs dried beans.
I don’t want to suggest that personal actions don’t matter, as there are undoubtedly many cases where they do. But it is an open secret that the ideas of personal carbon footprints and individual responsibility were promoted to divert attention away from the major polluters and create a feeling of hopelessness. As individual choices are almost always constrained by society and the environment, there is no successful path to decarbonisation that does not require a restructuring of society and the built environment far beyond what is possible by individuals.
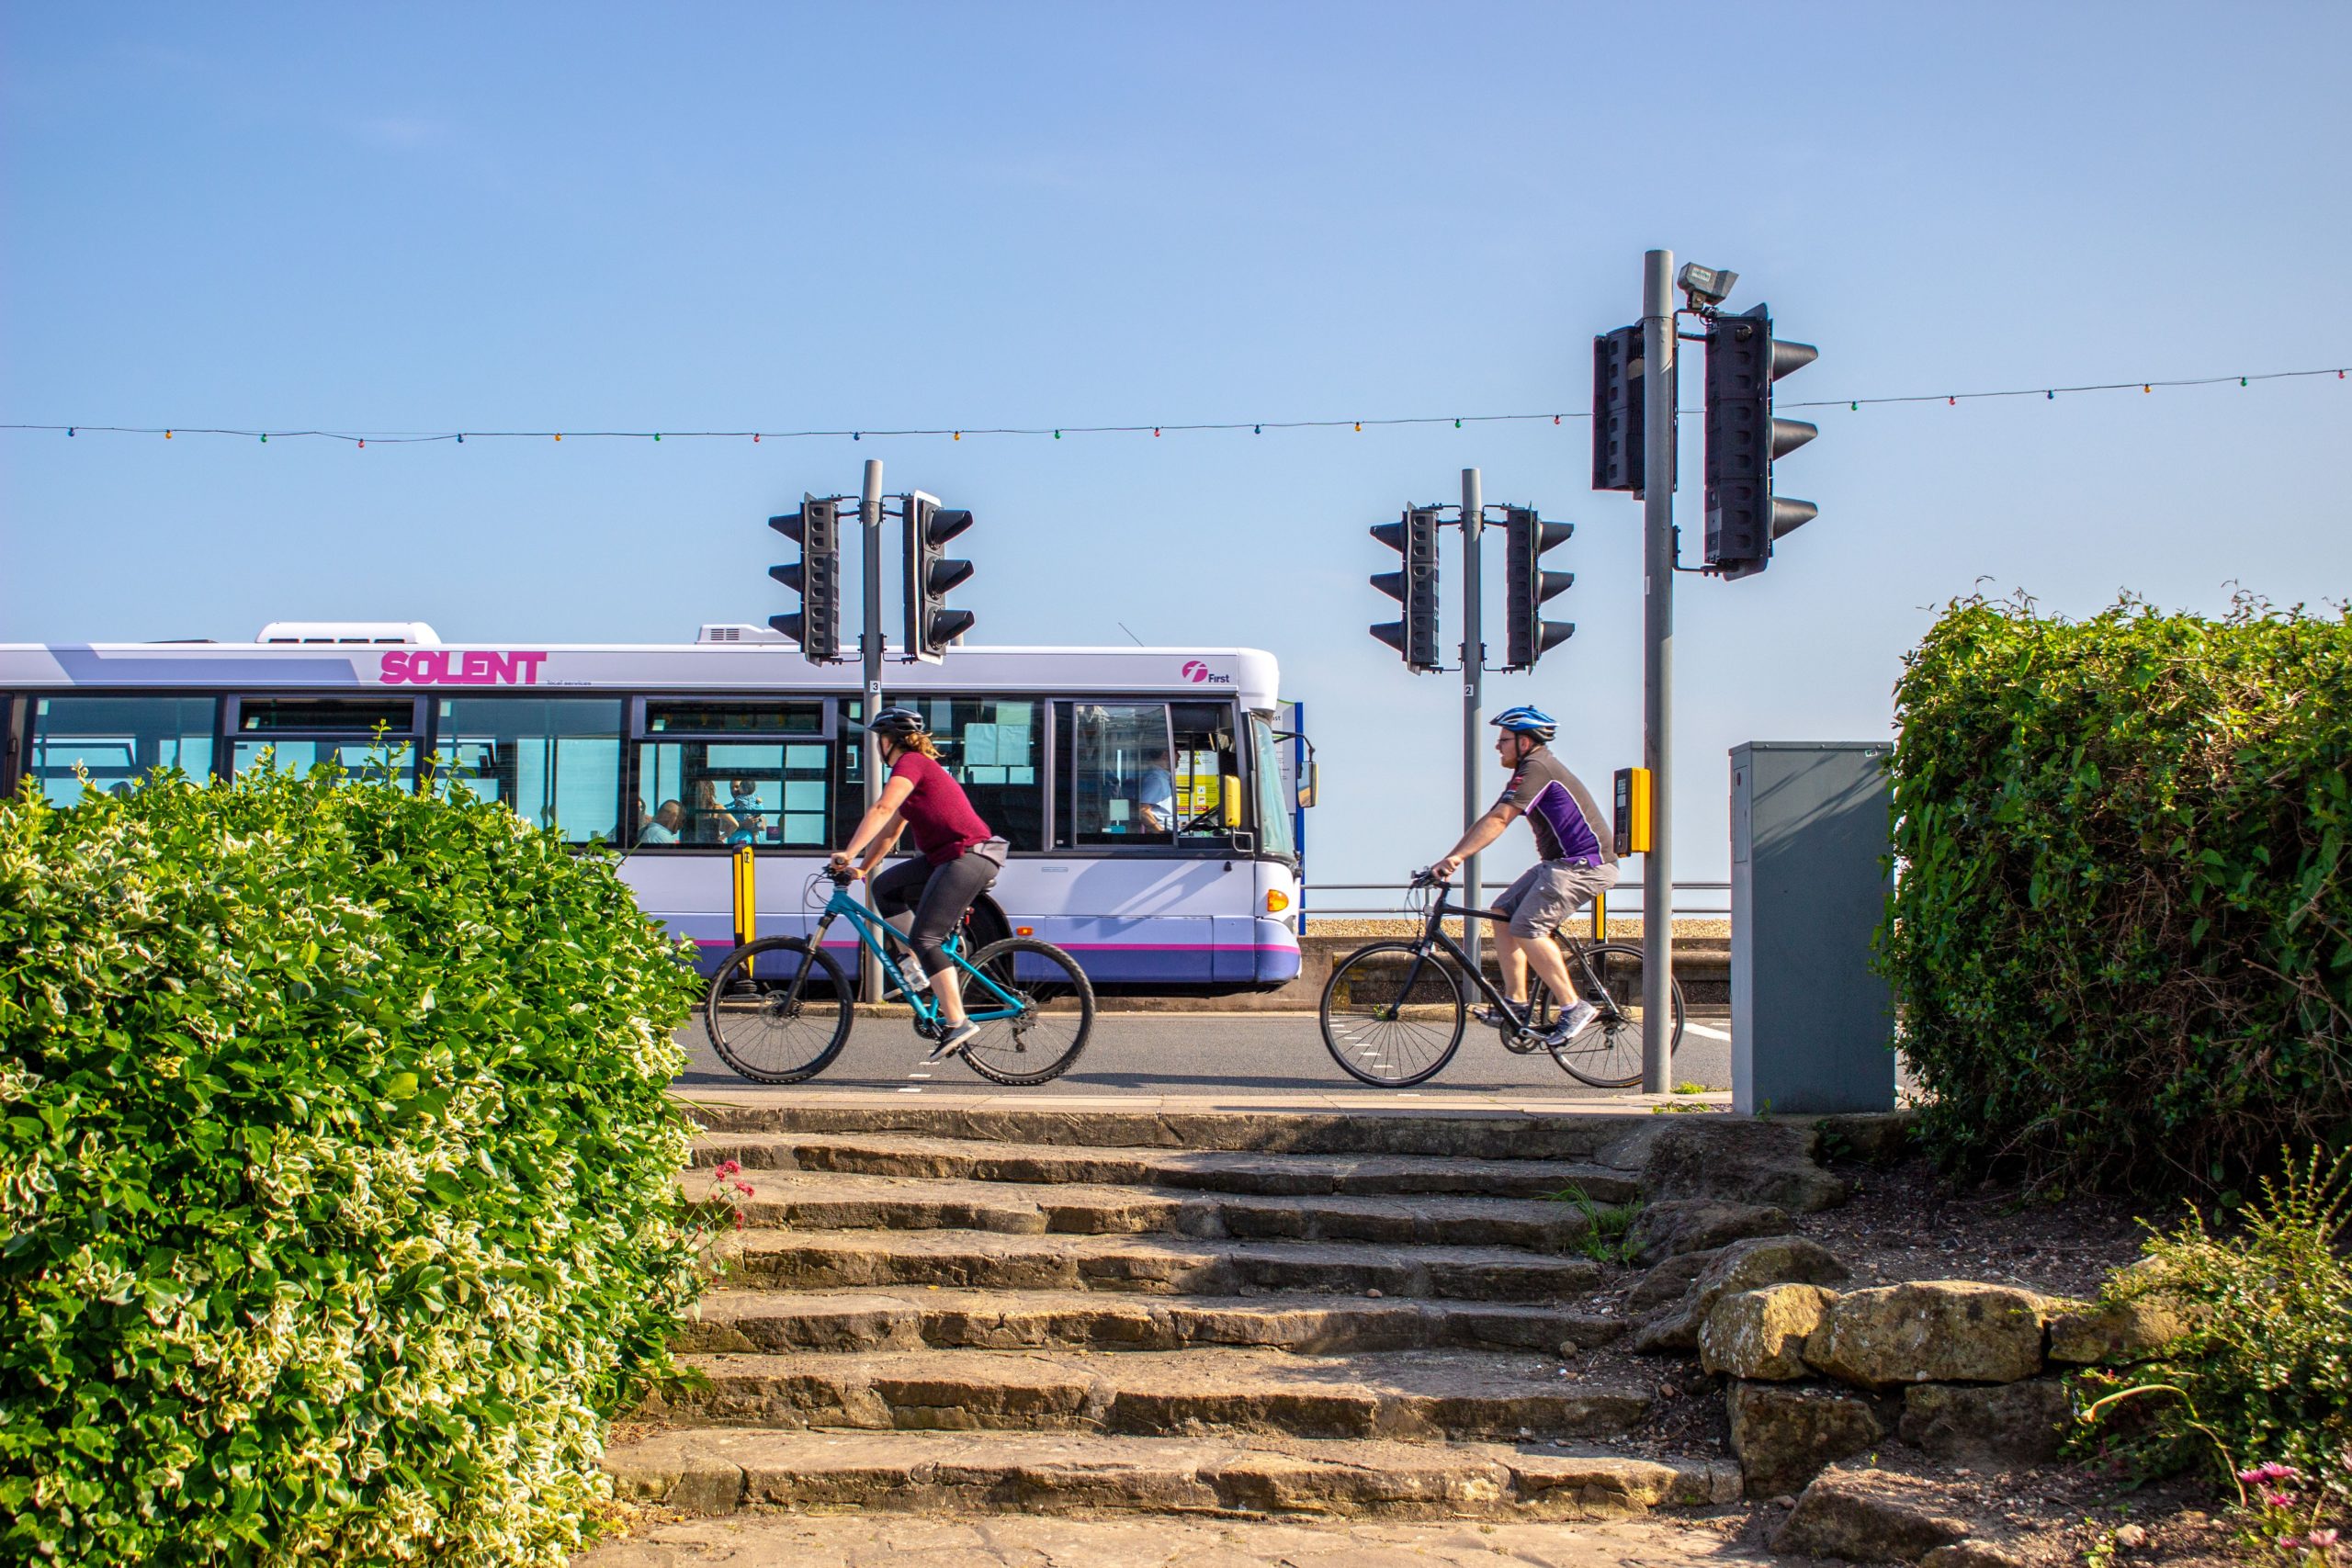
Consider a more meaningful example. We know we need to get people to drive less and cycle more, and the shift to cycling could make a big difference to our carbon footprints. We also know that peoples’ perception of safety strongly determines decisions whether to drive or cycle. Yet an individual can’t build cycle lanes or change traffic rules. So why do we admonish individuals for choosing the car, when they are often powerless to change their transport environment and make better choices?
This is not so for communities, which have the collective resources and powers to make meaningful change. A community, usually acting through the local council, can build the needed infrastructure or change the economic and social incentives that not only make a low carbon lifestyle possible but also the desirable and easy choice.
In this spirit, we set out to build the Place-Based Carbon Calculator to emphasise not individual choices that are hard to change, but structural issues that we can come together to solve as a community. The project was funded by CREDS and had three simple goals:
- Calculate the carbon footprint of each neighbourhood in England
- Add in as much context and explanatory data as possible, so we know why footprints vary and what we can do about it
- Present all this data in an accessible and easy to use format.
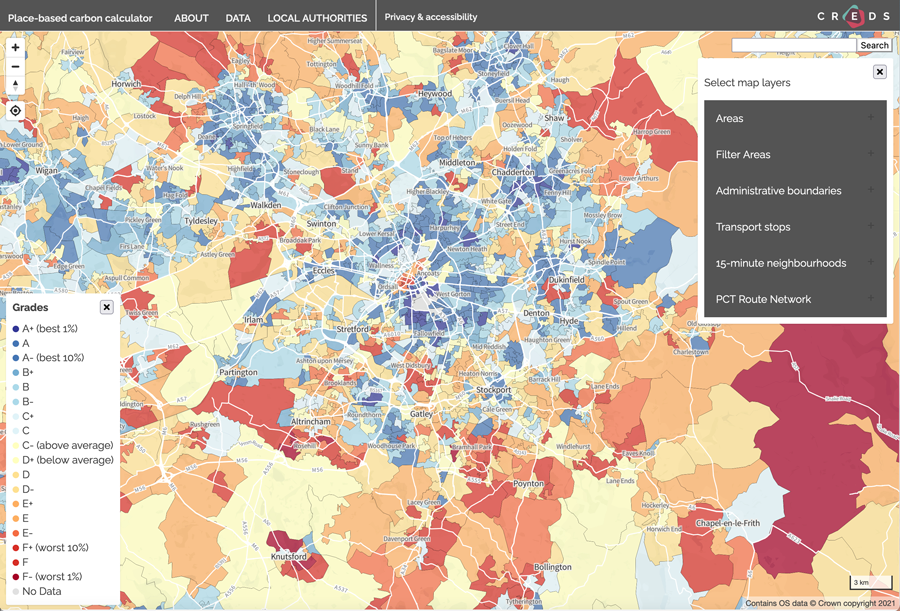 Figure 1: The complex pattern of high carbon (red) and low carbon (blue) neighbourhoods around Manchester.
The first challenge was getting all the necessary data to calculate a local carbon footprint. This was no small task. However, we do have a helping hand as there is reasonably good data on some of the significant sources of carbon emissions, such as buildings and transport. While for the many small carbon sources (such as what type of beans you eat), income is a good predictor of overall consumption and thus emissions.
So, we were able to crunch through the data and produce an average per person carbon footprint for each Lower Super Output Area (LSOA) in England. LSOAs are small statistical areas with an average population of about 1,500. We used LSOAs as their small size allows for lots of interesting local detail. Also, LSOA statistics are widely used in Government and academia, so we could also access lots of useful comparative and explanatory data.
It turns out that when you look at this scale, carbon footprints vary wildly and in interesting ways. The highest carbon areas have an average per person footprint more than eight times larger than the lowest carbon areas.
This highlights the main lesson from building the calculator. We are not effectively targeting decarbonisation policies in high carbon areas. For example, the recently collapsed Green Homes Grants scheme provided a grant to cover 66% of the cost (up to £5,000) of retrofitting homes. For people claiming certain benefits, the cap was raised to 100% and £10,000. But the calculator shows that the big polluters are the large homes in very wealthy areas. In these neighbourhoods, the issue is not affordability but motivation. For high income households, energy costs are a small proportion of their expenditure and so the cost savings for retrofitting their home are inconsequential. As there are no policy “sticks” to incentivise action in the collective interest it is unsurprising that high carbon neighbourhoods have not prioritised decarbonisation.
 Figure 2: The difference in frequency of public transport helps explain why some areas have much smaller carbon footprints than others. The tool maps every transit stop in Great Britain and shows stops with high frequency service (blue) and places with barely any public transport at all (red).
This brings us to the second challenge of contextual data and understanding, for we can measure our footprints until the cows come home. But the real goal is to reduce them. More than half of the data in the Place-Based Carbon Calculator was not needed to calculate the carbon footprints. It instead provides valuable insights into why the footprints vary. I already alluded to the variation in uptake of retrofit measures which we get from the Energy Performance Certificate Database, but we also include data on access to public transport, levels of cycling, and much more. It is this kind of data that people and politicians should focus on much more, and leave the abstract measuring of carbon footprints to dusty academics.
Short-term targets on housing retrofit or kilometres of cycle lanes built are much easier to understand and would make a far bigger impact to the climate than long-term abstract promises of reduced carbon emissions. Many of these actions are individually small, such as retrofitting a single home or implementing a low traffic neighbourhood. But they need to be done everywhere and at such speed that we could easily sustain a daily dashboard in the style of the UK Government’s Coronavirus Dashboard.
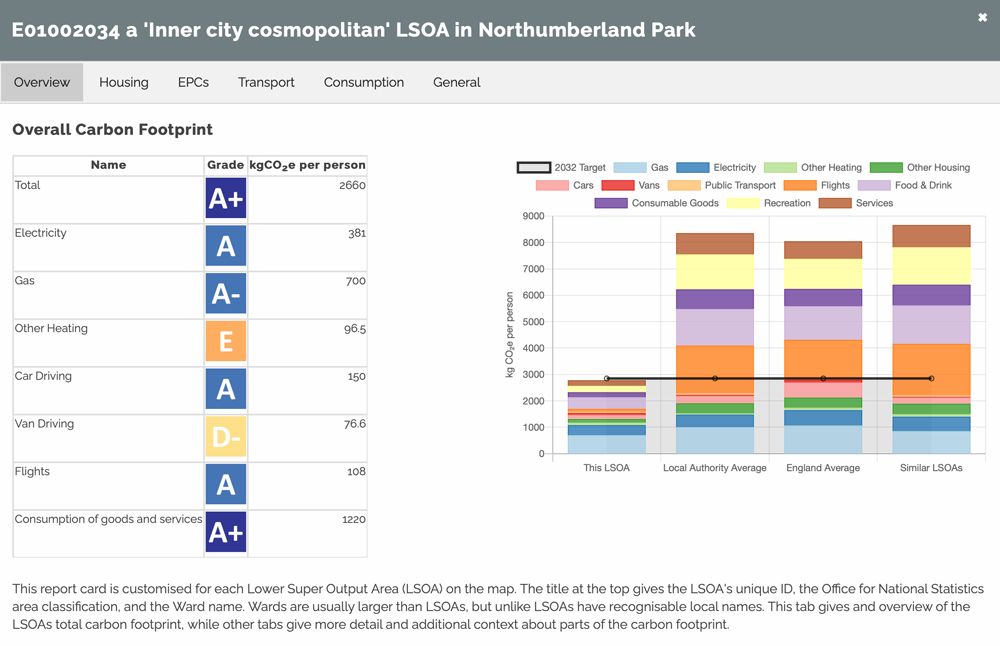 Figure 3: Clicking on any LSOA provides a detailed breakdown of the carbon footprint with graphs ratings and much more.
Presenting all this data in a format that can be easily understood by the public and policymakers was our final challenge. Web-based tools are great for making research accessible to a broader audience, and the place based nature of the tool leant itself to mapping. But the scale of the tool presented a real challenge. There is about 50 GB of data behind the tool, so it would be impossible for it to run on any ordinary PC, let alone a phone. So, the tool has been carefully designed to drip feed just enough data. Always giving the illusion that all the data is at your fingertips, while never giving you so much that your device is overwhelmed.
As well as overcoming the technical challenge of getting all this data to the user. We have been working closely with our local authority partners at Transport for the South East and Steer Group to ensure the tool’s design is clear and understandable. Their feedback has been invaluable in ensuring that the calculator becomes a useful tool rather than a technical curiosity.
The Place-Based Carbon Calculator (www.carbon.place) was launched on 29 June at a free web-event, and we hope that it will be used by policy makers and communities to plan and enact the changes that are needed to meet our carbon targets.
This blog was originally published by the Centre for Research into Energy Demand Solutions