Review of the CCC’s 7th Carbon Budget

Authored by Alice Garvey, Elliott Johnson, Jonathan Norman, Sam Betts-Davies and John Barrett from the Climate Evidence Unit at the University of Leeds.
Download the PDF from White Rose Online.
You can also read a summary blog of this review here.
Summary
The Climate Change Committee (CCC) has today (Wednesday 26 February 2025) published its recommendations to the UK Government on total greenhouse gas (GHG) emissions for the “Seventh Carbon Budget,” covering the period from 2038 to 2042. This advice provides robust evidence for the UK Government to set legally binding limits on permissible GHG emissions over this five-year period. The recommended target given by the CCC’s advice is to achieve an 87% reduction in UK emissions by 2040, setting the 5-year budget for 2038-2042 at 535 MtCO2e. In addition to these domestic targets, the UK has an international commitment—its Nationally Determined Contribution (NDC)—which aims to reduce UK GHG emissions by 68% by 2030 and 81% by 2035 compared to 1990 levels, all in pursuit of reaching net zero by 2050. The late 2030s may seem far off, but long-term planning is essential. Achieving these targets requires the rollout of low-carbon technologies and the building of consensus for social change. It gives much needed clarity to investors, businesses and citizens on the direction of travel.
We have evaluated the 7th Carbon Budget (CB7) report below and you can also access our blog published in the Conversation. The key takeaway from today’s report is clear: the transition to net zero is not only possible but highly beneficial. Independent academic analyses consistently support this conclusion (Johnson et al,. 2023), showing that it will strengthen the economy, deliver widespread co-benefits, and position the UK as a leader in global climate action. While the report acknowledges some upfront costs, it confirms that acting now will reduce expenses in the long run, with cost savings emerging by the late 2030s and beyond.
We also observed that the prevailing narrative often prioritises technology first, with social change as a secondary consideration. In this respect, there is a sense that the report preempts what the Government would prefer as opposed to challenging current thinking. The challenge with this approach is that failing to fully address demand increases the scale, cost and uncertainty of the technological transition and increases the risk of failure. More energy must be generated, more car miles need to be driven, and more materials and products must be supplied, making the transition more resource-intensive and expensive than necessary.
With this in mind, we have provided a sector level analysis that first identifies the key issues for each sector, the key technologies, and then considers the missed opportunities.
 Transport
Reliance on the technological transition
At present, transport is the highest emitting end use sector in the UK economy. Surface transport represented 24% of UK emissions in 2023 (102.8 MtCO2e) and aviation accounted for 8% of UK emissions (35.4 MtCO2e). To combat this, CB7 sets out an ambitious pathway for the transport sector. According to the Balanced Pathway, by the 7th carbon budget period (2038-2042), surface transport emissions will be reduced by 86% relative to 2023, and aviation emissions fall by 17%.
In surface transport there is a heavy reliance placed on the rapid and extensive rollout of Electric Vehicles (EVs) for cars and vans. EVs are the main source of decarbonisation in passenger transport and abate 73% of all surface transport emissions by 2050. There is only a limited role (8%) given to decarbonisation achieved through modal shifts to lower-carbon forms of transport such as public transport or active travel. In aviation, sustainable aviation fuels and demand management do the largest share of emissions abatement in the near term, with efficiency gains realised by low emission or electric aircrafts introduced later in the scenario.
Surface transport
- EVs carry a significant share of the burden for decarbonising surface transport, as opposed to reductions in car vehicle kilometres (vkm). Figure 1 shows that the CB7 Balanced Pathway has 4.1 times greater car kilometres per person than an alternative, demand-led pathway for transport decarbonisation (Brand et al, 2025). This has significant implications for critical raw materials, such as lithium, and the overall material intensity of the transition to net zero.
- Figure 2 highlights the relative speed of EV uptake in CB7, compared to the Positive Low Energy Futures (PLEF) scenarios and Norway's real world EV uptake, shifted 8 years forwards. It shows the scale of the challenge posed by CB7. Comparing the pace of rollout with the world-leading EV rollout of Norway, the UK would have to increase the proportion of vehicles that are EVs 1.5 times quicker than Norway has over the previous 8 years, with this all happening before the 2035 moratorium on ICE vehicle sales. However, the UK will benefit from better-established supply chains and an increasingly mature market.
- Comparing this uptake rate with scenarios that reduce the use of cars to meet mobility demand, CB7 implies a growth in the share of EVs of somewhere between shift and transform in the Positive Low Energy Futures Scenarios.
- However, if vkm correlates linearly with vehicle numbers, the CB7 scenario must achieve this whilst the size of the vehicle fleet is increasing, as per Figure 2. Whereas in the PLEF scenarios, the vehicle fleet is reducing in size, meaning to achieve a 100% electrified car fleet does not require a 1 for 1 substitution of ICEs.
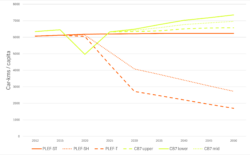
Figure 1: Annual car vehicle-kilometres in CB7 versus Barrett et al. (2022)
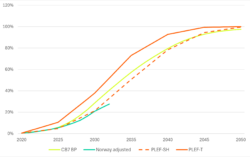
Figure 2: Electric vehicle uptake rates in CB7 compared to Barrett et al. (2022) and Norway’s historical uptake rate (adjusted by 8 years to begin at the same year)
Aviation
- By 2050, the CB7 Balanced Pathway finds reductions of 36% in aviation emissions, with the sector’s residual emissions being mitigated using negative emissions technologies.
- Of the cumulative emissions reductions achieved between 2025 and 2050, 47% of them come from demand management, reducing the increase in air travel demand growth over the scenario period. Demand management achieves 65% of the cumulative emissions reduction from aviation in the next five years, and 61% of emissions reductions by 2040, highlighting its near-term importance to reduce the impact of aviation, and the urgent need for aviation demand management policies such as a frequent flyer levy.
- However, technological solutions still play a highly significant role. Sustainable Aviation Fuels (SAFs) represent 6% of total aviation fuel demand in 2030, 17% in 2040, and 38% in 2050. Whilst the CB7 report recognises the risks of supply-chain availability of SAFs, and the lack of cost-competitiveness with regards to biofuel use in SAFs compared to other competing uses of biomass fuel such as Bioenergy with Carbon Capture and Storage (BECCS). That SAFs still account for 41% of the annual emissions abated in 2050 poses a technological risk to ensuring the aviation sector’s emissions are in line with net zero.
- The final method of emissions reduction stems from the introduction of hybrid-electric planes from 2030, and then fully electric aircraft in the 2040s. By 2050, hybrid and electric planes are expected to deliver 17% of the cumulative emissions reduction in the aviation sector. The extent to which this technology can be relied upon to deliver emissions reductions at scale is questionable. Whilst first commercial operations of hybrid electric planes are expected in the next few years, this technology will only be suitable to carry small aircraft of around 30 people relatively short distances.
- Residual emissions from aviation of 22.67 MtCO2e are removed through engineered removal methods, corresponding to 60% of the total engineered removals in the CB7 Balanced Pathway. Given the growing prominence of shorter international flights in Europe (Wadud et al., 2024), the reliance on these engineered removals could be further reduced if greater demand reduction was pursued, by way of modal shift to low carbon public transport, such as supporting high speed domestic and international rail.
Missed opportunities
Given the significant reliance on replacing internal combustion engine vehicles (ICEVs) with EVs, there is limited realisation of emissions reductions by way of reducing the use of car travel. As Figure 1 shows, car vehicle km per capita increase in the CB7 Balanced Pathway scenarios, leaving many co-benefits of modal shift in transport unrealised.
- Compared to the baseline, the CB7 Balanced Pathway includes a 7% modal shift away from cars when comparing 2050 to the baseline. This equates to 11% of the cumulative emissions reductions in surface transportation.
- When compared to the PLEF scenarios, that focus more greatly on shifting how people travel, approximately 50% of the reductions in emissions in surface transport stem from modal shifts in how we travel or reducing the need to travel by way of coordinating planning and transport objectives (Brand et al., 2025).
- That the CB7 Balanced Pathway overlooks modal shifts and car-km avoidance misses a key opportunity to ease EV rollout pressures. It also locks in high levels of material demand associated with an electrified private transport system and misses out on several co-benefits that a sufficiency-led transport system helps to achieve.
- Measures to reduce car travel in the transport sector also induce a series of co-benefits, such as cleaner air quality, reduced congestion, and health benefits from active travel measures. Distributional outcomes are improved as low-income households not locked into expensive modes of personal transport. Further co-benefits that are more difficult to quantify include more and vaster green spaces in urban areas, increased social cohesion and better access to local services.
- The CB7 scenarios assume a halt in the trend towards larger vehicles, holding total weight constant at present day sizes. Whilst this is an important intervention, it misses the potential benefits of reversing this trend, particularly when these benefits are increased in an electrification-led scenario. Lighter vehicles mean lower embodied emissions, fewer pressures on critical mineral imports as smaller batteries are needed, lower electricity demand, improved air quality from tyre and road wear particulate emissions (Brand, 2024), and safer streets.
- In aviation, whilst there are some measures to reduce its demand, it remains a high impact sector, requiring 60% of the UK’s engineered removal capacity in 2050 to mop up residual emissions. Whilst many price-led demand measures are suggested, such as a frequent flyer levies on tickets, there is limited consideration of the potential for modal shift away from aviation towards other modes of travel. This is particularly important not just for domestic aviation but given the growing trend towards short-haul international aviation trips, many of these could feasibly be replaced by the increased availability and price competitiveness of trains from the UK to Europe (Wadud et al., 2024).

Industry
Reliance on the technological transition
Emissions from industry are due to fall by 78% by 2040, relative to 2023 under the Balanced Pathway, with almost complete decarbonisation by 2050. Much of the reduction is driven by electrification, with carbon capture and hydrogen being utilised where this is not possible. There is significant reduction of 45% in the energy use per unit of output in industry between 2025 and 2050, which is similar to the trend seen between 1998 and 2022. Whereas previously this was mainly driven by structural shifts towards higher value manufacturing, future changes will result from electrification and the inherent efficiency of technologies such as heat pumps, alongside improved energy and resource efficiency.
- There is large growth of heat pumps within industry, and the higher temperatures they will be required to supply in comparison to domestic applications pose a significant challenge. Heat pumps are currently not utilised within UK industry and significant uptake relies on the further development of high temperature units, assumed to become available between 2028-2030.
- The potential barrier to high levels of electrification of grid connection availability is rightly recognised and requires a well-considered plan. Industry will need confidence that sufficient grid connections are available if they are to invest in new electric technologies.
- There is not excessive reliance on the use of hydrogen and carbon, capture and storage technologies. The use of hydrogen has reduced considerably compared to the Balanced Pathway in CB6. Utilising electrical technologies were available, with these riskier alternatives only being deployed where necessary, is a sensible approach. The development of hydrogen and CCS technologies in the short-term, with both areas showing uptake by 2030 under the Balanced Pathway, will be a technological challenge.
Missed opportunities
Resource efficiency opportunities make a small, but significant, contribution to overall reductions within industry. The potential of this opportunity is indicated by the 26% savings by 2035 in the cement sector and there is a recognition that additional opportunities could exist in other sectors, although further evidence is required to demonstrate this potential. The opportunity for demand side actions such as longer-lasting electronics and clothing is recognised in its potential to reduce imported emissions but are excluded from the Balanced Pathway. Although this is reasonable given the focus of the budget on territorial emission, it overlooks the potential for these actions to drive broader emissions mitigation, and to provide additional benefits to consumers.
- Industrial supply chains are inherently international and maximising the potential mitigation opportunities requires approaches and agreements that are not constrained by domestic borders. If the focus moves beyond a territorial emissions target, resource efficiency and demand side actions become more important.
- The potential for resource efficiency across the full range of sectors is underexplored and represents a missed opportunity. Previous analysis found a 26% reduction in energy demand across industry through resource efficiency (Barrett et al. 2022).
- Construction of buildings and infrastructure (including that required in the energy transition and for adapting to a changing climate) are a key driver of demand for emissions-intensive materials such as cement and steel. It is not clear what levels of construction are implied by CB7 and so what role resource efficiency could play here.

Buildings
Reliance on the technological transition
The UK’s buildings sector has been slow to decarbonise so far. For residential buildings, emissions have reduced by 2.16% per year in the last 15 years, but will need to reduce by 7.5% per year from 2025-2040 according to the CCC’s Balanced Pathway. In absolute terms, emission will have to start declining from an average of 1.47 MtCO2 per year to almost double the rate, at 2.72 MtCO2 per year.
The majority of emissions (96%) are sourced from fossil fuel-based space and water heating systems that utilise natural gas. Mitigation measures for the residential sector include installing low carbon options for space and water heating (e.g. electrical-based heat pumps, heat networks and resistive heating systems, or alternatively hydrogen boilers), insulation measures and more energy efficiency appliances. Other options include changes to the ways in which households use energy, such as reductions in the level of floorspace per person, altering the times at which we demand energy, and reducing shower times.
Our analysis highlights:
- The drastic emissions reductions achieved by 2050 are largely driven by technological change, mainly to the provision of heating systems. In the CCC’s Balanced Pathway, 70% of the emissions savings in 2050 compared to the baseline are derived from low-carbon heating installations.
- There are considerable demand reductions in the residential sector of 41% from 2025-2050. In the short term, these are driven by energy-saving practices and improvements to the fabric efficiency of buildings. However, by 2050, efficiency gains from electrification will drive most of this reduction.
- The CCC’s Balanced Pathway includes optimistic assumptions about the deployment of heat pumps in residential buildings, requiring a substantial scaling up of supply chains and skills training to meet the levels required to decarbonise the sector. However, their analysis still suggests that the UK will miss the government’s target of 800,000 heat pump installations per year by 2028, only installing 240,000 instead. The 800,000 target is only met in 2032.
- In contrast to the Sixth Carbon Budget analysis, hydrogen is not presented as an option for reducing emissions in the residential sector. The CCC’s rationale for this is strong, highlighting the difficulty in hydrogen meeting domestic energy demands in comparison to already established technologies (i.e. heat pumps) and the risks in developing the requisite infrastructure over timescales where immediate decarbonisation is required.
Missed opportunities
Overall, changes to the ways in which energy is used by households beyond technological provision are limited in the CB7’s pathway. There is a limited scope for energy saving actions beyond thermostat temperature setpoints and boiler flow temperatures driven by changes to the social provisioning of housing:
- These measures are assumed to have largely been implemented by the beginning of the scenario in response to high energy prices in recent years and are not developed any further as the scenario develops, with total per year emissions reductions staying relatively stable at 4 MtCO2 from 2025-2050. This artificially limits the capacity for further social changes to contribute to emissions reductions.
- Significant sufficiency-based measures are excluded from the Balanced Pathway, such as a reduction in average floor-space per person, driven by increased occupancy rates and the expansion of co-housing, which has been shown to be a key driver of residential energy demand.
- This measure can be achieved whilst having important and considerable synergies with construction and increasing the housing stock, as existing unused commercial buildings can be re-appropriated for residential use, avoiding demand for carbon intensive materials for buildings.

Agriculture and Land
Reliance on the technological transition
The CB7 analysis identifies savings from 3 main groups of measures for agriculture and land use: low-carbon farming practice and technology (35% of the 2040 emissions reduction), reducing livestock numbers (32% of the 2040 emissions reduction), land management related savings (32% by 2040).
- Technical options around soil and livestock management achieve 14% of the total emissions reduction by 2040. The decarbonisation of on-farm machinery contributes 21% of emissions reductions. Reductions from changing farming practices are predicated on reductions to livestock numbers, indicating that the total emissions reductions are reliant on achieving the measures as a coherent package. By 2050, the land released through reductions to livestock numbers allows mitigation of 11 MtCO2e through increased available land for tree planting.
- Abatement rates by 2040 (see Figure 3) for the Land Use, Land Use Change and Forestry sector (LULUCF) appear to be lower than estimated in CB6. This may be due to a lack of progress in tree planting, woodland creation and peatland restoration as identified by the 2024 progress report. There is an assumption about the sequencing of measures wherein dietary shifts and other measures drive reductions to livestock numbers, which leads to greater land availability, which means in turn that the maturation of tree planting efforts then allows the land use sector to become a net sink. This highlights the interdependencies of achieving mitigation across households, agriculture and land management.
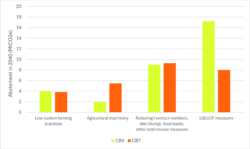
Figure 3: Comparison of abatement by 2040 per headline measure in CB6 and CB7 analysis.
- There is notably no mention of ‘lab-grown meat’ in CB7, but instead a focus “existing alternative protein products”, “plant-based whole foods” and later on “novel alternative proteins” such as products made through precision fermentation techniques. This contrasts with optimistic assumptions around lab-grown meat in CB6, in which the Widespread Innovation scenario assumed increased acceptance and uptake of lab-grown meat by 2035.
- Despite the prevalent focus on ‘technical’ measures within the food sector, even options which are technical in nature could face challenges in terms of behaviour and public engagement, particularly given increased public interest and scrutiny of net zero in the food sector. For instance, the introduction of methane-reducing feed additives has faced recent backlash and misinformation.
Missed opportunities
CB7 recommits to the 35% reduction in average meat consumption by 2050, as previously set out in the Balanced Pathway of CB6. However, CB7 identifies a steeper reduction of 40% by 2050 for red meat specifically and sets out the modal shifts in meat consumption that would make behavioural shifts realistic, accessible and fair. They base these assessments partly on findings from a citizen’s panel, and supplement this with nutrition, cost and distributional impact assessments of proposed dietary changes.
- Citing a £900m health net benefit by 2040, CB7 presents a comprehensive and coherent evidence base around the co-benefits of pro-environmental dietary change. The headline meat reduction target set out would achieve an 8 MtCO2e saving by 2040 due to reduced livestock numbers. This assumes a relationship between demand for meat products and livestock herd size.
- Though there is deeper consideration of dietary behaviour change in CB7 than in any previous analyses, the headline consumption changes can be considered fairly conservative in comparison to other scenarios. Even in CB6, three of the five scenarios presented proposed a 50% reduction to meat consumption. In a UK context, our analysis has found that the Planetary Health Diet for instance could involve an 88% reduction to red meat consumption against current levels of consumption (as well as an increase of 11% to white meat consumption).
- Though the targeted meat/dairy reductions are fairly conservative in broader context, there is mention of fairly ambitious mechanisms by which these targets could be achieved. For instance, a Carbon Border Adjustment mechanism on imported meat.
- The moderate commitment to reductions in meat and dairy consumption perhaps reflects recent politicisation of agriculture and the framing of lower-meat diets as a signifier of political identity. The report comes in the wake of prime ministerial comment at COP29 that the government “won’t be telling people how to live their lives” and former CCC chief executive Chris Stark saying the public can still “fly off on holiday and eat steak” under net zero. This means the CCC must walk a fine line in terms of promoting credible climate ambition whilst balancing a changed political climate and the need for policy pragmatism.

Supply-side and CCS
The 7th Carbon Budget’s Balanced Pathway takes a much more conservative approach to the role of carbon capture and storage in comparison to the 6th Carbon Budget:
- CCS is limited to industrial subsectors where there are no other cost-effective options for abatement.
- Total engineered removals in CB7’s Balanced Pathway are approximately 40% lower than the previous Balanced Pathway, at just less then 30 MtCO2 per year in 2050, compared to a range of 45-111 MtCO2 per year in CB6 (see Figure 4)
- However, the CCC state that there is no feasible route to net zero emissions without carbon capture and storage. However, other analyses, which show alternative routes to net zero emissions in the UK show that it can be achieved without negative emissions technologies (Barrett et al., 2022).
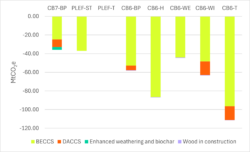
Figure 4: Total engineered removals in 2050 across different UK scenarios. PLEF-ST and PLEF-T refer to the Shift and Transform scenarios in Barrett et al. (2022).
The dominance of technological solutions in end-use sectors leads to a hugely increased role for the power sector:
- Generation capacity increases from 127 GW in 2025 up to 341 GW by the middle of the 7th carbon budget, before reaching 427 GW in 2050 – increasing by a factor of 3.4 times. Exploring the full range of demand reduction options available could limit this proliferation in capacity to just 2.3 times (Johnson et al., 2023).
- Such dramatic increases in power capacity and generation place even greater strain on renewable sources of energy on the supply-side, with implications for energy and emissions embodied in their manufacturing processes, which are not accounted for in the CCC’s modelling process, as well as material impacts.
- There is also a sizable increase in nuclear power capacity beyond what is currently available. Nuclear capacity drops by 2030 as a large proportion of the existing nuclear fleet is decommissioned, but capacity then increases dramatically out to 2050, reaching almost 11 GW.
Further information
Authored by Alice Garvey, Elliott Johnson, Jonathan Norman, Sam Betts-Davies and John Barrett from the Climate Evidence Unit.
How to cite: Garvey A., Johnson E., Norman J., Betts-Davies S., Barrett J., (2025). Review of the UK Climate Change Committee's Seventh Carbon Budget. Priestley Centre for Climate Futures, Climate Evidence Unit, University of Leeds. https://doi.org/10.48785/100/317
For media enquiries, please contact Kersti Mitchell in the University of Leeds press office via k.mitchell@leeds.co.uk