AI can map the outline and area of giant icebergs
Scientists have trained an artificial intelligence or AI system to accurately map in one-hundredth of a second the surface area and outline of giant icebergs captured on satellite images.
It is a major advance on existing automated systems which struggle to distinguish icebergs from other features in the image.
Human or manual interpretation of the satellite imagery is the other option and although the results are accurate, it can take several minutes to delineate the outline of a single iceberg. If that has to be repeated numerous times, the process quickly becomes time-consuming and laborious.
Icebergs have a significant impact on the polar environment and monitoring them is critical for both maritime safety and scientific study. They can be extremely large - in some cases the size of small countries - and can pose a risk to passing ships. As they melt, icebergs release nutrients and freshwater into the seas, and this can have an impact on marine ecosystems.
Dr Anne Braakmann-Folgmann, who led the study while undertaking doctoral research at the Centre for Polar Observation and Monitoring at the University of Leeds, said: “Icebergs exist in hard-to-reach parts of the world and satellites are not only a fantastic tool to observe where they are, they can help scientists understand the process of how they melt and eventually begin to break apart.
“Using the new AI system overcomes some of the problems with existing automated approaches, which can struggle to distinguish between icebergs and other ice floating on the sea or even a nearby coastline which are present in the same image.”
Neural network
Dr Braakmann-Folgmann and her colleagues used an algorithm called U-net - a type of neural network - to “train” a computer to accurately map the outline of icebergs from images taken by Sentinel-1 satellites operated by the European Space Agency.
As part of the study, the effectiveness of the U-net algorithm was compared to two other state-of-the-art algorithms used to map icebergs. They are known as k-means and Otsu. The algorithms were programmed to identify the biggest iceberg in a series of satellite images.
Image 1 shows the U-net algorithm correctly identifying the iceberg, which is highlighted in red. In comparison, the k-means algorithm has incorrectly identified a cluster of smaller icebergs and ice fragments, shown in blue, as one large iceberg. That is revealed in image 2.
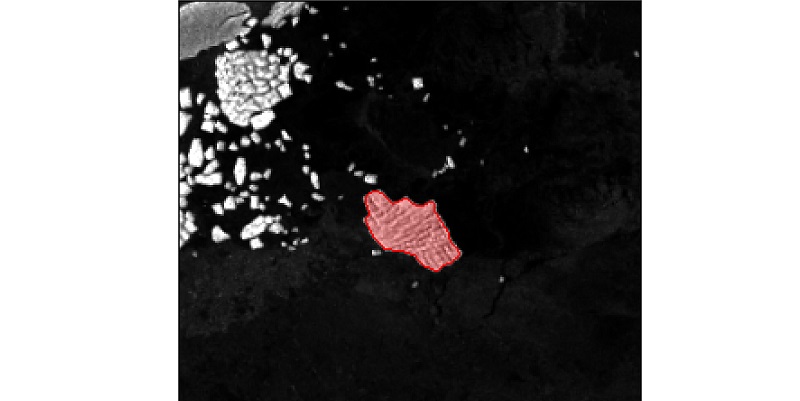
Image 1. Picture credit: Dr Anne Braakmann-Folgmann and European Space Agency
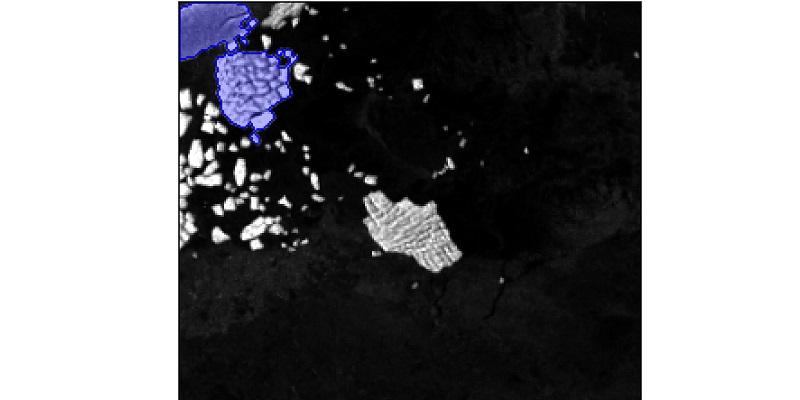
Image 2. Picture credit: Dr Anne Braakmann-Folgmann and the European Space Agency
Image 3 shows the U-net correctly identifying the iceberg, this time surrounded by sea ice. The iceberg is highlighted in red, and the sea ice is seen as a grey structure. However, the k-means algorithm has identified the iceberg and the sea ice as a single iceberg. It is unable to differentiate between the two, despite them being distinct objects, where sea ice is flat ice on the sea and an iceberg standing metres above it. Shown in image 4.
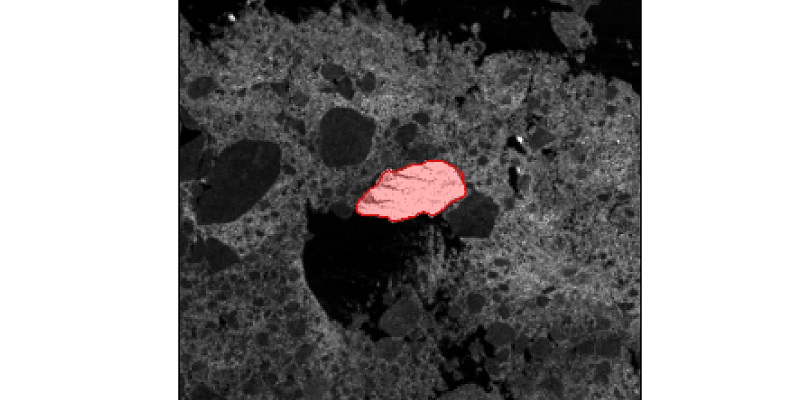
Images 3. Picture credit: Dr Anne Braakmann-Folgmann and the European Space Agency
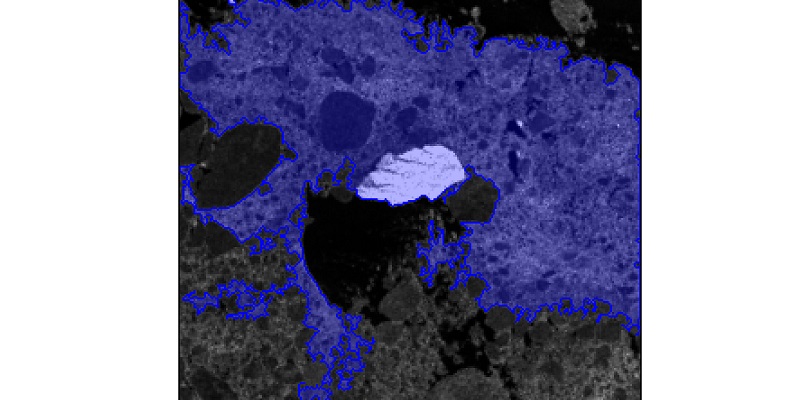
Image 4. Picture credit: Dr Anne Braakmann-Folgmann and the European Space Agency.
Dr Braakmann-Folgmann, now based at the Arctic University of Norway in Tromsø, said the technology could result in new services which provide information about the shape and size of giant icebergs. Current mapping services show only the midpoint or central location and length of icebergs. Interpretation by this new approach means their outline and area can be calculated.
She added: “Being able to automatically map iceberg extent with enhanced speed and accuracy paves the way for an operational service providing iceberg outlines on a regular, automated basis.
“Combining them with measurements of iceberg thickness, also enables scientists to monitor where giant icebergs are releasing vast quantities of freshwater into the oceans. There are services that give data on the location of icebergs – but not their outline or area.
Precision of the mapping system
The system has been tested on satellite images of seven icebergs, which were all between the size of the city of Bern - 54 km2; and Hong Kong - 1052 km2. For each of these icebergs, up to 46 images were used that covered all seasons from 2014-2020.
Over a series of tests, U-net outperformed the other two algorithms and was more effective in delineating the outline of an iceberg in images taken when environmental conditions were challenging, such as the image capturing a lot of ice structures.
In machine learning, the F1 score is an evaluation of how well an algorithm performs and ranges from 0 to 1, with values closer to one displaying more precision. U-net achieved an F1 score of 0.84. The two other algorithms both scored 0.62.
Andrew Shepherd, Professor at the University of Northumbria and one of the co-authors of the study, said: "This study shows that machine learning will enable scientists to monitor remote and inaccessible parts of the world in almost real-time. And with machine learning, the algorithm will become more accurate as it learns from errors in the way it interprets a satellite image.”
Further information
The paper - “Mapping the extent of giant Antarctic icebergs with Deep Learning” is published in the journal The Cryosphere.
Please use email to David Lewis in the press office at the University of Leeds
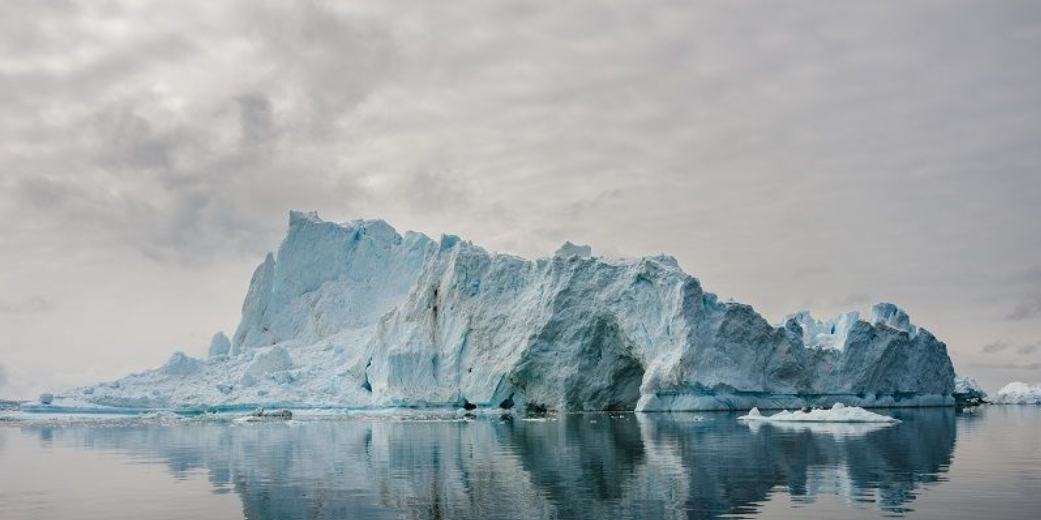
Top image: Adobe photostock – an iceberg at Disko Bay, Greenland.