We passed 1.5°C of human-caused warming this year (just not as the Paris agreement measures it)

Human-caused global warming has just nudged past 1.5°C, according to a new method we have developed. That’s approaching 0.2°C higher than previously thought.
But this does not mean the goal of keeping warming below 1.5°C is dead, as the Paris agreement and the UN climate summits are based on different methodology.
This additional warming comes out of how we define what was pre-industrial, with our method using bubbles of air buried in Antarctic ice to gather data reaching back well before the industrial era. Current methods exclude some of the early warming. We also radically improve how well we know these numbers.
There are two steps to measuring human-caused warming. The first requires us to compare temperature measurements with their pre-industrial counterpart – we call this the pre-industrial baseline. The second step involves separating the human contribution from the part humans are not responsible for, such as volcanic eruptions, El Niño, or random weather events – we call this natural variability.

The Intergovernmental Panel on Climate Change (IPCC) chose the period 1850-1900 as the pre-industrial baseline as that’s when we started meaningfully measuring the temperature around the world, even if the Industrial Revolution actually began earlier. Warming since this period is what negotiators would have had in mind when setting up the Paris agreement. Climate models and statistical analysis are then used to tease out the volcanoes and short-term weather fluctuations in the data, to leave just the human-caused bit.
Using these methods, by 2023 there had been 1.31°C of human-caused warming since 1850-1900. However, there is considerable uncertainty in figures like this, and the reality could be somewhere between 1.1°C and 1.6°C. So although we are likely to be around 0.2°C below the 1.5°C limit, using these previous approaches we cannot be certain that we are not already past it.
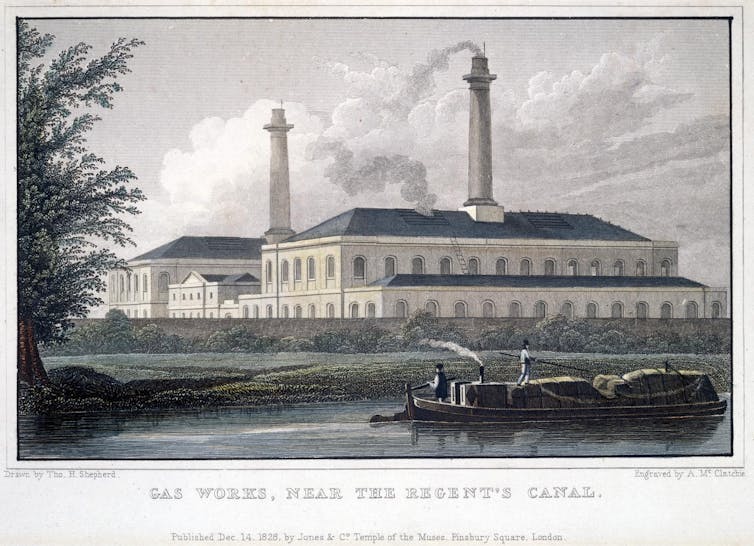
Unfortunately, the 1850-1900 pre-industrial baseline probably has human-caused warming baked into it because the Industrial Revolution started significantly before then. As a result, the human-caused warming we are currently negotiating on is an underestimate.
A new approach
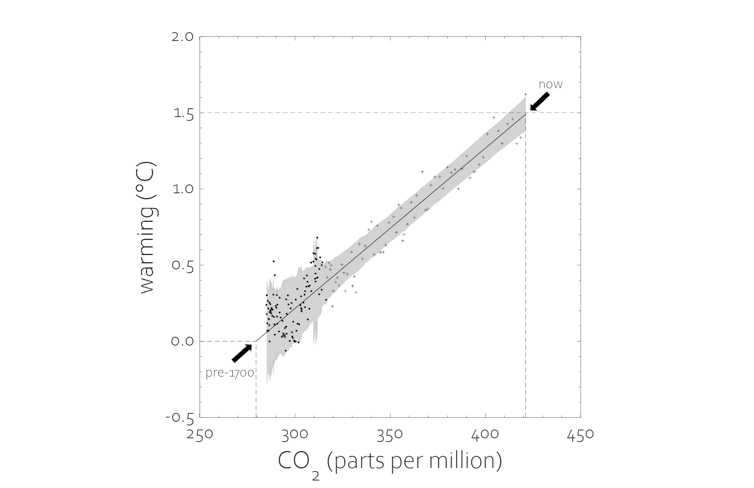
Fortunately, our new method means we can make significantly more accurate estimates. That’s because of a simple but previously overlooked relationship between the CO₂ concentration we measure in the atmosphere and the temperature change we see.

We treat this relationship as a straight line, meaning a certain amount of additional atmospheric carbon will always be associated with the same amount of warming. This is somewhat controversial, but allows us to do a number of very useful things.
First, it allows us to build from a pre-industrial baseline well before 1850. This is because unlike global temperature measurements we have ice core CO₂ data stretching back thousands of years, well before the start of the Industrial Revolution. This data is gathered by drilling down through the Antarctic ice cap and harvesting the air trapped in the bubbles in the ice. The further you drill down, the older the air.
That data tells us that CO₂ concentrations in the atmosphere were pretty constant for two millennia at 280 parts per million, before they started rising from about 1700. We can then estimate the temperature change associated with that additional carbon, which tells us how much warming was baked into the 1850-1900 baseline currently used by the IPCC.
Second, the CO₂-temperature straight line relationship also allows us to separate the human-caused warming from the natural variability, because the warming trend we are after is so closely related to increases in CO₂ we measure.
A more accurate estimate
Using our new method we can estimate human-caused warming either from our pre-1700 baseline or from the IPCC’s 1850-1900 baseline. Using the 1850-1900 baseline we estimate human-caused warming for 2023 at 1.31°C, agreeing with the IPCC-based best guess. However, our estimate is three times better defined. Although we have experienced record warming in 2024, we can be sure human-caused warming has not yet passed 1.5°C if measured from 1850-1900.

When measured from the pre-1700 baseline, humans have caused warming that almost hit 1.5°C in 2023, and as of October 2024 is at 1.53°C (within a range of 0.11°C). This captures a fuller picture of the warming caused by centuries of human activity as rising levels of deforestation, farming and early industries all contributed to increases in carbon dioxide levels. This result tells us there is approaching 0.2°C of warming baked into the 1850-1900 baseline from ignoring the effects of the early emissions released before the temperature records began.
1.5, dead or alive?
As the Paris agreement is based on science that used 1850-1900 as a baseline, the additional early warming we flag may not in the end be counted towards the temperature goals. So it’s unfair to say the 1.5°C limit has been breached by our latest estimate. Yet even if we stick to the 1850-1900 pre-industrial baseline, 1.5°C of human-caused warming is less than a decade away at current warming rates. The 1.5°C Paris limit is certainly critically ill.
But perhaps this is not the right way to see 1.5’s role. The agreed aim is to hold the temperature increase “well below 2 degrees”, and the super tanker that is the global economy will need something strong to pivot from to change course. Keeping 1.5 in reach is currently that anchor point. Knowing precisely where we are in relation to this anchor will be critical. And maybe this is where our research will help most.
Written by Professor Piers Forster, University of Leeds and Dr Andrew Jarvis, Lancaster University.
This article has been reposted under the creative commons license from The Conversation.
Featured image: ISS049e028944 (10/05/2016) ---The sun rises slowly spreading a golden glow over the Earth as the International Space Stations speeds by on orbit. The crew of Expedition 49 captured this image.
